最新版 .NET Memory Profiler v5.7 更新於 2023/2/8
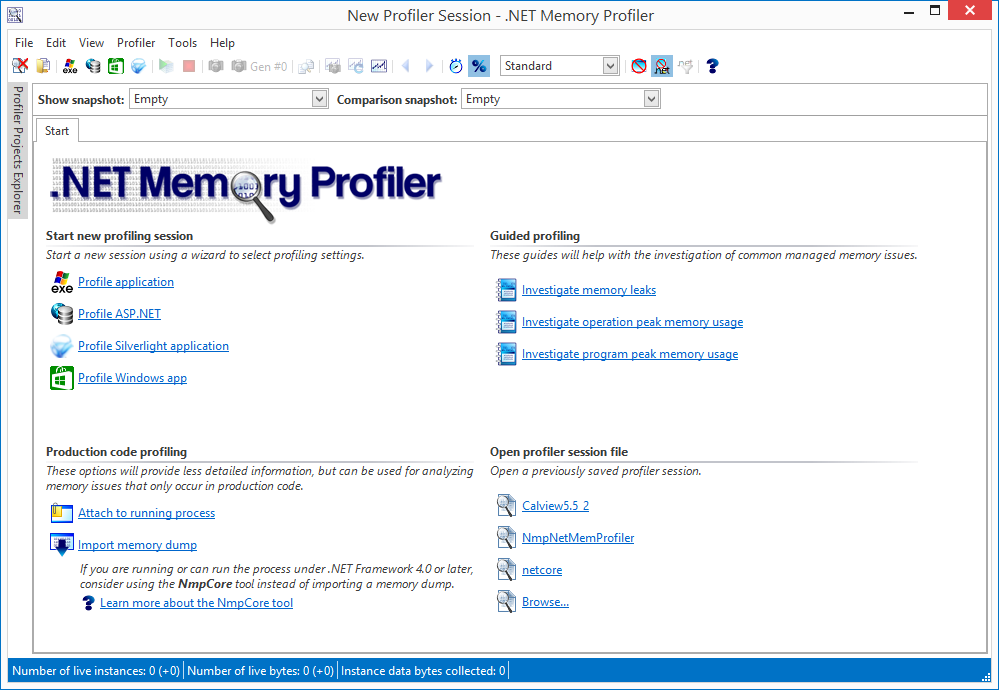
.NET Memory Profiler 是一款強大的工具,專門做為檢視內存跟踪和優化以C#,VB.NET或任何其他.NET語言編寫的程式的軟體。有了分析指南,自動記憶分析儀,和專門跟踪的幫助下,您可以確保您的程式有沒有內存或資源的洩漏,內存使用則盡可能的優化處理。
- 基本應用例如winform,console application等
- ASP.net 應用
- WPF應用
- Window 服務
該工具可對基本.net應用程序進行內存的跟踪。三種內存包括:
- 託管內存
- 線程託管內存
- 非託管內存
.png)
更新介紹
The major new features of .NET Memory Profiler 5.7 are:
- Improved support for .NET Core 3.x and .NET 5.0
- New implementation of debug profiling
- New implementation of unit test profiling
- Unit test data collector for VSTest
- Better support for Visual Studio 2019 and the latest Visual Studio previews
- Hybrid inspection snapshots
- Identification of delegate target Method
- WPF cleanup support in .NET Core 3.x and .NET 5.0
- Identification of instances in the pinned heap
系統需求
NOTE! .NET Memory Profiler can be run on Windows 7/8/8.1/10/11, or Windows Server 2008/2012/2016/2019/2022.
.NET Framework (v4.5.2 or later) must be installed on the system before installing the memory profiler.
|
Find memory leaks |
|
Make your programs run faster |
|
Automate memory testing |
|
Reduce resource usage |
|
Investigate memory problems in production code |
|
Improve your debugging experience |
 Use the .NET Memory Profiler API to automatically detect memory leaks and control the profiler from within the profiled program.
  .NET Memory Profiler is fully integrated with Visual Studio. Investigate memory usage directly from the development enviroment and get detailed memory information while debugging.
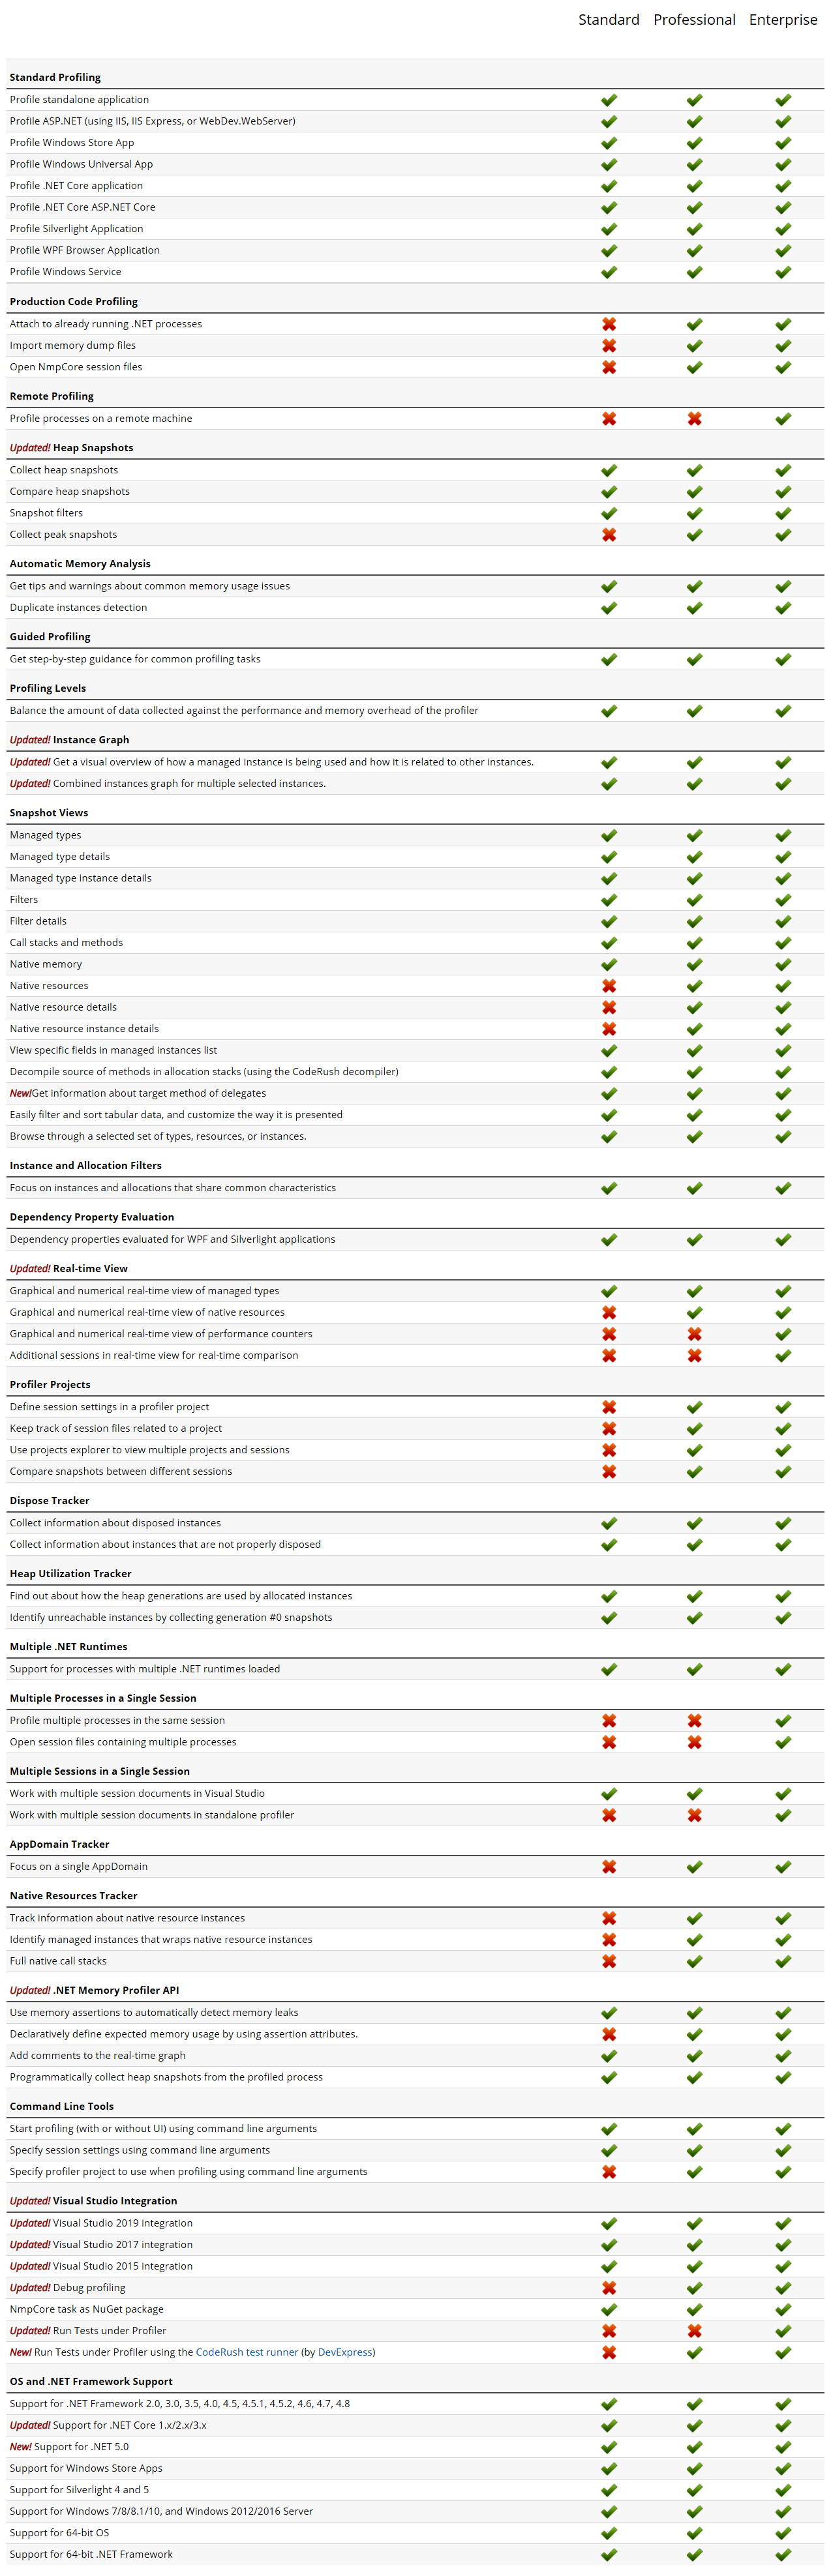
| Standard | Professional | Enterprise | |
| Production Code Profiling | |||
| Attach to already running .NET processes | V | V | |
| Import memory dump files | V | V | |
| Open NmpCore session files | V | V | |
| Remote Profiling | |||
| Profile processes on a remote machine | V | ||
| Updated! Heap Snapshots | |||
| Collect heap snapshots | V | V | V |
| Compare heap snapshots | V | V | V |
| Snapshot filters | V | V | V |
| Collect peak snapshots | V | V | |
| Updated! Real-time View | |||
| Graphical and numerical real-time view of managed types | V | V | V |
| Graphical and numerical real-time view of native resources | V | V | |
| Graphical and numerical real-time view of performance counters | V | ||
| Additional sessions in real-time view for real-time comparison | V | ||
| Profiler Projects | |||
| Define session settings in a profiler project | V | V | |
| Keep track of session files related to a project | V | V | |
| Use projects explorer to view multiple projects and sessions | V | V | |
| Compare snapshots between different sessions | V | V | |
| Multiple Processes in a Single Session | |||
| Profile multiple processes in the same session | V | ||
| Open session files containing multiple processes | V | ||
| Multiple Sessions in a Single Session | |||
| Work with multiple session documents in Visual Studio | V | V | V |
| Work with multiple session documents in standalone profiler | V | ||
| AppDomain Tracker | |||
| Focus on a single AppDomain | V | V | |
| Native Resources Tracker | |||
| Track information about native resource instances | V | V | |
| Identify managed instances that wraps native resource instances | V | V | |
| Full native call stacks | V | V | |