最新版 MultiCharts / MultiCharts .NET 15 更新於 2024/3/5
MultiCharts 是一款專業的程式交易軟體,它可用於市場分析、期貨、股票和外匯交易等,讓您在競爭激烈的世界貿易市場取得重要地位。 MultiCharts 所具備的功能,有助您實現交易目標。高清晰的圖表、指標及戰略決策、單擊交易圖表、高精度回溯測試、暴力演算法以及基因演算法策略最佳化,自動執行並支持EasyLanguage scripts,皆是任你處置的關鍵工具。
一個交易平台要同時適用於股票、期貨、外匯甚至是其他金融市場是非常困難的。但是一個好的交易軟體可以增加你在現今複雜的交易市場中的競爭優勢。要完成一次成功的交易,你會需要什麼?穩健的交易策略、快速而正確的市場行情報價、迅速而穩定的委託執行、還有最低的手續費用。MultiCharts的優勢就在於他可以同時滿足你交易的所有需求。
MultiCharts 新版介紹
Features
Charting
General Improvements
Data and Brokerage
Manual Trading
Usability/Visual
Keyboard Shortcuts
Bugs Fixed & Improvements"
General Improvements
Charting/Data Handling
Trading
Scripts/Calculations
Stability
Usability/Visual
*圖表分析
圖表繪製在程式交易軟體裡是非常重要的功能之一。你必須觀察市場價格的走勢,以產生交易決策。對繪製軟體而言,擁有調整任何特定需求彈性是很重要的,圖表也要是能穩定的,才能避免在分析重要資訊息時遇到中斷或失敗。在設計 MultiCharts 的同時,我們已考慮過所有可能的問題。
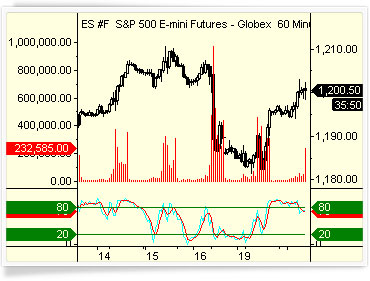
*量分析
量分析的重要性也不容小覷,注重"量"可了解市場移動的關鍵差異。
*圖表類型
你需要有專業的工具在你的電腦上做專業的技術分析。MultiCharts擁有各種不同的圖表類型滿足你個人化的需求。每一張圖表提供市場上不同的觀點,所以你可以做出明智的選擇。
*繪圖工具
MultiCharts提供了多樣化的繪圖工具。可用來標定趨勢、缺口、三角形及其他價格型態。包含了趨勢線、安德魯音叉線、費波南西速阻弧形線、甘氏矩陣及其他只需要簡單的滑鼠點擊和拖拉就可以完成畫線。
*技術分析
MultiCharts提供你不同於其他大多數技術分析軟體更先進的分析工具。廣泛的指標、圖表類型、繪圖工具及交易策略都已為準備好讓你能立即使用。當然也包含數百個免費的指標及策略。事實上,MultiCharts最大的優勢是在現代、易變及不斷變化的市場上,當你有一個技術分析的新想法時,我們的技術分析軟體可以依你的需要做調整。成功的交易者不僅需要建立新的交易策略,也會需要那些經過時間驗證的交易訊號。 有許多有用的資訊能讓增加知識、提供新的想法。舉例來說,你可以在熱門的刊物上找到技術股票分析想法,如:Technical Analysis of Stocks and Commodities,Futures Magazine及Active Trader。網路資源與線上論壇是另一重要的資源,因為這些都是由交易員經營並提供持續性的更新。這些資源都可能帶給你新的交易想法、市場分析,甚至是EasyLanguage腳本範例。MultiCharts的使用者能充份利用這些資源,發展自己的交易觀念及策略。
*相容 EasyLanguage
市場掃描視窗在其他的交易軟體被稱為"報價表"或"雷達掃描"。類似Excel表,具有顯示數以千計串流報價的功能及其他重要的資訊。也可以在報價上增加技術分析指標方便你即時監看整個市場的變化。
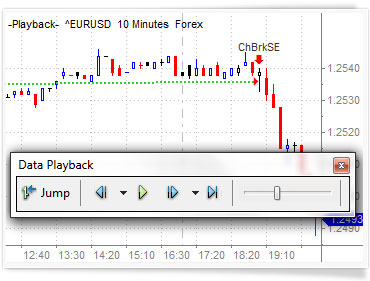
*模擬重播
模擬重播提供讓你不需花錢就能培養盤感的好方法。此功能對於使用價格型態或其他方式手動交易者更為重要,因為這類交易方式通常很難建立正確的交易模型。可自由調整播放速度。
*策略交易
*策略開發
使用的程式語言專門為交易設計,即使是沒有任何程式經驗的開發者,也能開發策略參與設計
*策略回測的精確度
*交易系統分析
MultiCharts的策略績效報告是一個功能強大的分析工具,適合管理期貨基金及一般交易者使用。有超過200種評估績效的方法,一些有用的評估結果顯示在策略績效總結果、績效比率、時間分析、交易明細、總交易分析、極端交易、最大獲利和虧損、交易序列分析及週期性分析。
*交易策略最佳化
交易策略是基於對市場的歷史走勢而產生的交易概念、想法及心得,並將其導入交易系統。當你每天在做市場研究時,其實你就是在做最佳化的動作。所以,我們在建立交易策略的過程其實就是一個最佳化的過程。最佳化會大量測試不同的參數組合,找出績效最好的結果。
*基因演算法策略最佳化
*移動窗格最佳化
移動窗格最佳化其實同時包含了最佳化與回測。在最佳化的過程中,最佳化的參數會在真實市場的條件下進行驗證,查看真正的執行狀況。
*自動交易
即使是一個獲利的策略,只要在委託執行的時候碰到短暫的延遲,結果可能天差地遠,在開發完成一套交易策略後,下一步就是設法讓策略訊號自動傳送委託單。自動執行交易讓高頻率的交易策略變成可行且更具競爭力。
*投資組合回測
投資組合回測就是一次在許多工具中運作一個或一個以上的策略—在歷史資料數據和測量績效上做測試,就像所有商品在這些策略中被交易。在測試期間,不同的商品甚至可能有不同的結果—逐筆、三分鐘、9天或其他。在投資組合回測期間,你也可以使用一個以上的交易策略。可以建立你的商品群組,且每一個群組可以有自己的策略。
*視覺交易
視覺交易讓你方便地拖放委託單到你的圖表上或DOM視窗,並藉由簡單地拖拉方式快速地進行調整。視覺價格標示會比傳統的輸入委託單的方式更為方便及直覺。這就像現代的Windows視覺化介面,而非舊式的DOS模式只能文字輸入。你將有一個兼具便利性及功能強大的全新交易介面。
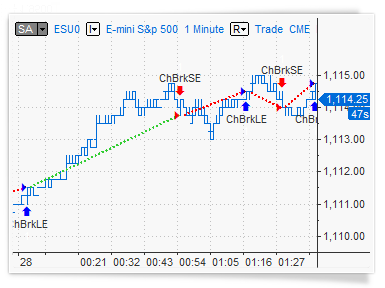
*圖表交易
視覺圖表交易能跟上你快速交易的步調,可以直接拖放委託單到圖表上—不用再計算點位及輸入。任何時候你都可以移動委託單到其他價位。所有的進/出場策略也可以像普通委託單一般直接拖放到圖表上。
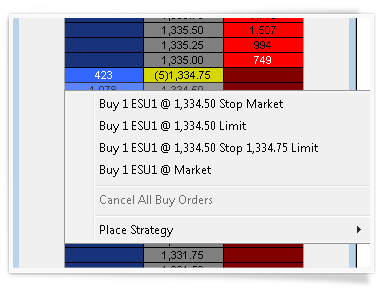
*下單匣
下單匣式一個從電子交易開始時就有的標準委託單輸入介面。兼具簡單與精確—輸入確定的價格、選擇委託單類型與買進或賣出。下單匣具有頁籤切換的功能,每個頁籤代表一個經紀商設定檔。最重要的優點是在同時可透過多個經紀商進行交易。
*交易追蹤視窗
*市場深度視窗
*自動進場與出場策略
有時候可能沒時間手動設置進場或出場OCO群組單,因此我們內建一些自動策略讓你輕鬆的拖放到圖表上。你可以將進出場策略拖放至圖表上任何位置,或連結到某個特定的委託單或部位。
*商品轉換
*數據管理
- MultiCharts trading platform;
- Free FX data for 1 year (Limited time offer!);
- Free Live Chat and email technical support;
- Free major and minor version upgrades;
- Fast online environment-friendly delivery.
- Regular MultiCharts package;
- Dedicated personal technical support line;
- Bloomberg data feed plugin.
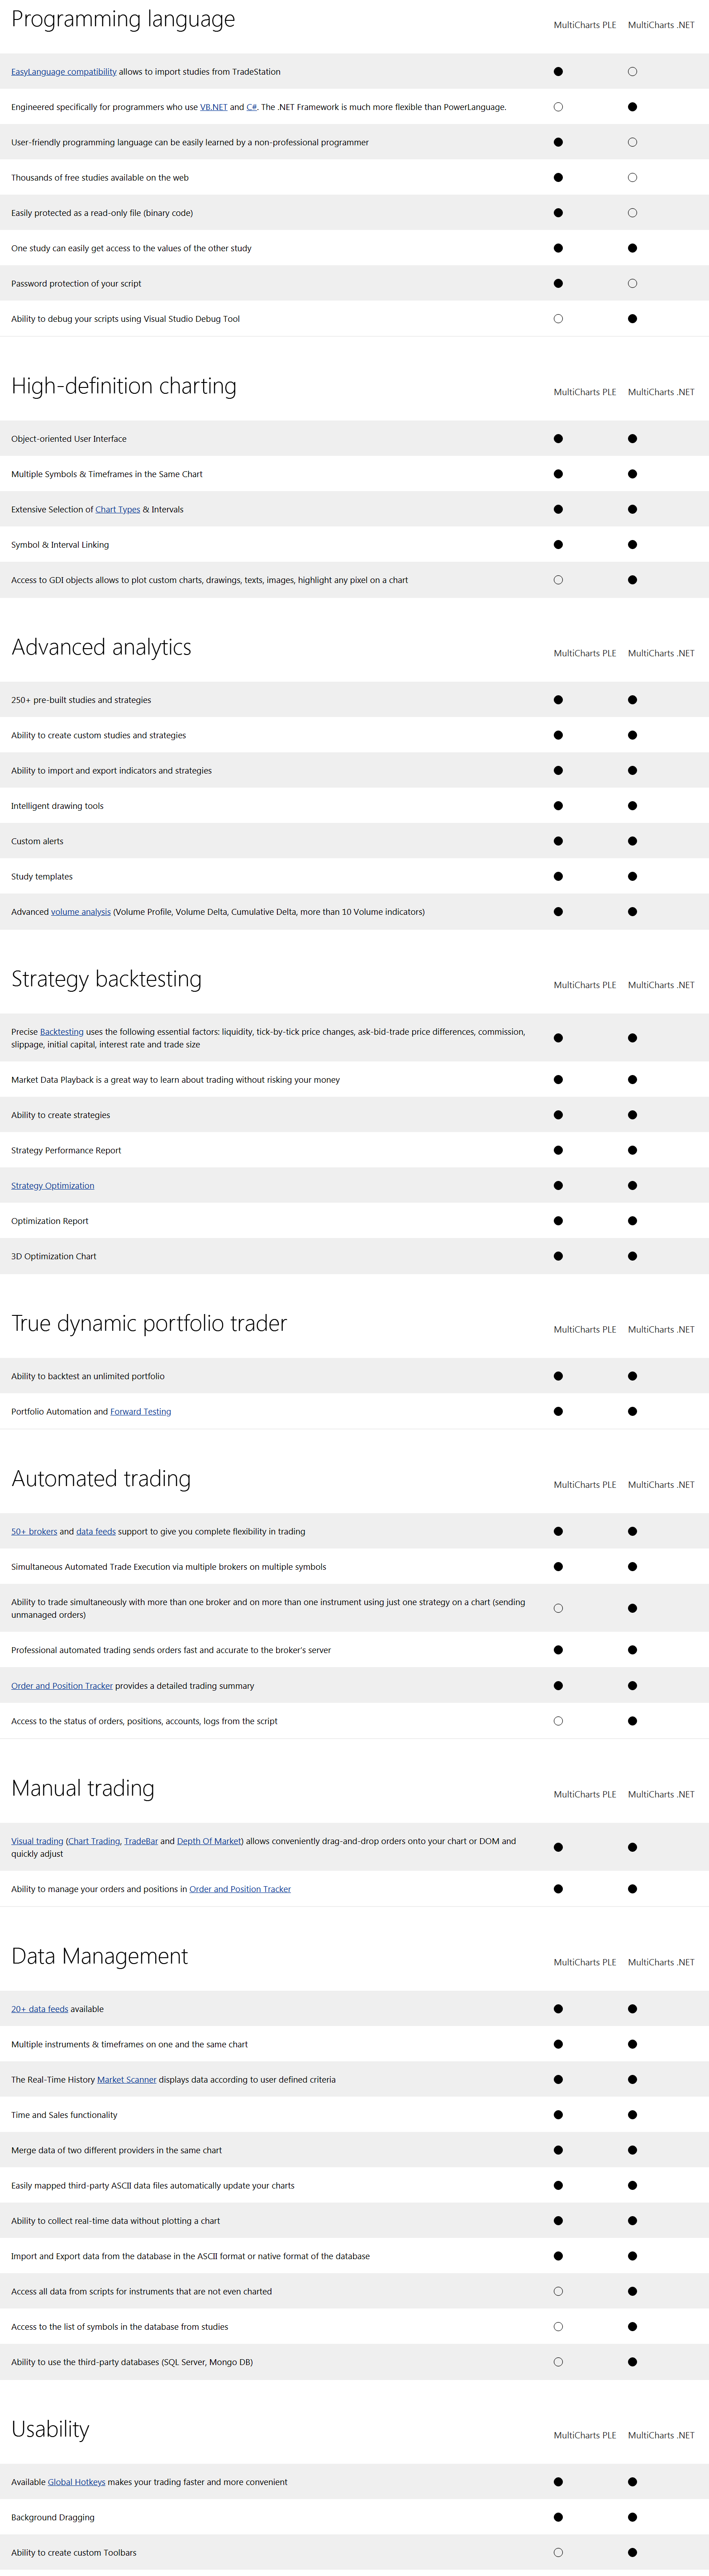
| MultiCharts PLE | MultiCharts .NET | |||
|
EasyLanguage compatibility allows to import studies from TradeStation
|
 |
-
|
||
|
Engineered specifically for programmers who use VB.NET and C#. The .NET Framework is much more flexible than PowerLanguage.
|
-
|
|
||
|
User-friendly programming language can be easily learned by a non-professional programmer
|
|
-
|
||
|
Thousands of free studies available on the web
|
|
-
|
||
| Easily protected as a read-only file (binary code) | |
- | ||
| One study can easily get access to the values of the other study | |
|
||
| Password protection of your script | |
- | ||
| Ability to debug your scripts using Visual Studio Debug Tool | - | |
||
|
|
MultiCharts PLE
|
MultiCharts .NET
|
||
|
Object-oriented User Interface
|
|
|
||
|
Multiple Symbols & Timeframes in the Same Chart
|
|
|
||
|
Extensive Selection of Chart Types & Intervals
|
|
|
||
|
Symbol & Interval Linking
|
|
|
||
|
Access to GDI objects allows to plot custom charts, drawings, texts, images, highlight any pixel on a chart
|
-
|
|
||
|
|
MultiCharts PLE
|
MultiCharts .NET
|
||
|
250+ pre-built studies and strategies
|
|
|
||
|
Ability to create custom studies and strategies
|
|
|
||
|
Ability to import and export indicators and strategies
|
|
|
||
|
Intelligent drawing tools
|
|
|
||
|
Custom alerts
|
|
|
||
| Study templates | |
|
||
| Advanced volume analysis (Volume Profile, Volume Delta, Cumulative Delta, more than 10 Volume indicators) | |
|
||
|
|
MultiCharts PLE
|
MultiCharts .NET
|
||
|
Precise Backtesting uses the following essential factors: liquidity, tick-by-tick price changes, ask-bid-trade price differences, commission, slippage, initial capital, interest rate and trade size
|
|
|
||
|
Market Data Playback is a great way to learn about trading without risking your money
|
|
|
||
|
Ability to create strategies
|
|
|
||
|
Strategy Performance Report
|
|
|
||
|
Strategy Optimization
|
|
|
||
| Optimization Report | |
|
||
| 3D Optimization Chart | |
|
||
|
|
MultiCharts PLE
|
MultiCharts .NET
|
||
|
Ability to backtest an unlimited portfolio
|
|
|
||
|
Portfolio Automation and Forward Testing
|
|
|
||
|
|
MultiCharts PLE
|
MultiCharts .NET
|
||
|
50+ brokers and data feeds support to give you complete flexibility in trading
|
|
|
||
|
Simultaneous Automated Trade Execution via multiple brokers on multiple symbols
|
|
|
||
|
Ability to trade simultaneously with more than one broker and on more than one instrument using just one strategy on a chart (sending unmanaged orders)
|
|
|||
|
Professional automated trading sends orders fast and accurate to the broker’s server
|
|
|
||
|
Order and Position Tracker provides a detailed trading summary
|
|
|
||
| Access to the status of orders, positions, accounts, logs from the script | |
|||
|
|
MultiCharts PLE
|
MultiCharts .NET
|
||
|
Visual trading (Chart Trading, TradeBar and Depth Of Market) allows conveniently drag-and-drop orders onto your chart or DOM and quickly adjust
|
|
|
||
|
Ability to manage your orders and positions in Order and Position Tracker
|
|
|
||
|
|
MultiCharts PLE
|
MultiCharts .NET
|
||
|
20+ data feeds available
|
|
|
||
|
Multiple instruments & timeframes on one and the same chart
|
|
|
||
|
The Real-Time History Market Scanner displays data according to user defined criteria
|
|
|
||
|
Time and Sales functionality
|
|
|
||
|
Merge data of two different providers in the same chart
|
|
|
||
| Easily mapped third-party ASCII data files automatically update your charts | |
|
||
| Ability to collect real-time data without plotting a chart | |
|
||
| Import and Export data from the database in the ASCII format or native format of the database | |
|
||
| Access all data from scripts for instruments that are not even charted | - | |
||
| Access to the list of symbols in the database from studies | - | |
||
| Ability to use the third-party databases (SQL Server, Mongo DB) | - | |
||
Usability
| MultiCharts PLE | MultiCharts .NET | |
| Available Global Hotkeys makes your trading faster and more convenient | V | V |
| Background Dragging | V | V |
| Ability to create custom Toolbars | V |
| Minimum | Recommended | Power user | |
| CPU* | Dual Core | Quad Core | Octa Core or higher |
| (2.5 GHz or higher) | (3 GHz or higher) | (3.5 GHz or higher) | |
| RAM | 4 GB | 8 GB | 16 GB or higher |
| Free space | 2 GB | 10 GB | 50 GB or higher |
| Monitor | Resolution of 1280 x 1024 or higher | 4K display (resolution of 3840x2160) | Multi-monitor solution |
Starting from MultiCharts 14 only 64-bit version is available for downloading
A power user is someone who uses 1 or more of the following: 5 or more tick charts, 10 or more interval charts, 15 or more indicators or signals on a chart.
*Intel 64 (AMD64) architecture processors
Note: MultiCharts requires that you have .NET Framework 3.5, 4.0 and 4.6.1 installed.
MultiCharts works on Windows 10 and 11
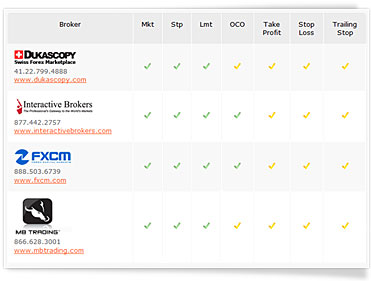
Brokers & data feeds
To receive real-time data, you need a compatible data vendor subscription or an account with a compatible brokerage. For more information please review the list of supported brokers and data sources.
64-bit
MultiCharts 64-bit version allows to engage more RAM, as the result it can handle more charts, studies, and data.
Outdated versions can be used in 32-bit, please contact our support team to request the download link.
Scripting language
MultiCharts supports EasyLanguage to a maximum possible extent. Studies are first translated into C++ and then efficiently compiled, resulting in the extremely fast execution speed that is so critical for handling very large volumes of data. Nearly all of the advanced capabilities of EasyLanguage, including custom DLLs, are supported by MultiCharts.
Development technologies
MultiCharts’ architecture is written in C++, and it uses hardware resources to the fullest possible extent. It is a multi-process application that efficiently passes information between the processes to achieve maximum efficiency. MultiCharts runs parallel tasks on each processor, which dramatically improves the system performance. MultiCharts technology is also multiple-monitor friendly, allowing multiple chart windows to be detached from the main application and displayed across all of the available monitors simultaneously.
Multi-threading
MultiCharts is a multi-threaded application. This means that the more CPU cores your computer has, the faster backtesting and optimization in MultiCharts will work. With modern multi-core processors we can now meet traders’ rapidly growing demands for speed and efficiency in trading platforms.
MultiCharts .NET - Powerful C#/VB Trading Platform
MultiCharts .NET Analyze charts, create powerful strategies and indicators in C# and VB, and place automated or manual trades! MultiCharts .NET is an award-winning trading software platform with C# and VB support.
MultiCharts .NET including trading capabilities (chart, DOM, drag-and-drop strategies and fully automated), best charting in the industry, advanced strategy development capabilities in C# and Visual Basic, integration with Visual Studio, high-precision tick-by-tick strategy and portfolio backtesting, extremely fast optimization and more.
- Real-time market scanner
- C# programming language
- Dynamic portfolio backtesting
- High-definition charting
- Choice of brokers and feeds
- Automated trading
 |
Best-in-Class Volume AnalysisImportance of volume analysis cannot be underestimated. Paying attention to volume can be the crucial difference in understanding how the market will move. Volume Profile, Volume Delta, Cumulative Delta and pre-built Volume Indicators are designed to help you understand not only how much was bought, but at which prices activity was the highest, and whether there are more buyers than sellers. |
20 + Data FeedsWe feel that you should have the freedom of choice, and that’s why we have added support for over 20 different data feeds to MultiCharts. Competition is good, that’s why you can pick the providers that suit you best, and change them at any time. No strings attached. |
 |
 |
Automated TradingEven with a winning strategy, just a short delay in order execution can make all the difference. After developing a strategy, the next step is to actually send the orders. The key advantage of automated trading is that it can send orders a lot faster than a human being. This can give you an advantage over the competition! |
One-click trading from Chart & DOMTake control of your trading and act quickly when you see an opportunity – place orders in seconds through our Chart Trading & DOM. It’s simple and intuitive, you can click or drag-and-drop orders onto your chart. MultiCharts features many tools to help you achieve your goals – Chart Trading, Trade Bar, Order and Position Tracker, Depth of Market, Automation of Entries and Exits, and Symbol Mapping. |
 |
 |
Hundreds of Strategies & IndicatorsWe have collected the most popular indicators and strategies we could find, and included them in the platform for free, so you don’t have to look for them. All you need to do is right-click on the chart, and they are at your fingertips. Remember, you can always add more, or write your own in addition to existing ones. |
Replay Market DataTrading the markets is all about predicting where the price will go next. A good way to practice is to apply your price-predicting skills to historical data. Market Data Replay allows you start playback at any point in the past, speed up or slow down replay speed, and even playback several instruments at once. |
 |