.jpg)
 UCINET 是一套全面的分析數據,及其他一維和二維的數據分析,可讀寫多種不同的格式化文字檔案,以及EXCEL的檔案。最高可處理32767節點。社會網絡分析方法包括核心措施、鑑定小組、分析角色、圖論基礎、排列型統計分析。另外包含強大的矩陣分析程式,例如矩陣代數、多元統計。
UCINET(University of California of Irvine Network Programms)由於其使用上較簡單,不論對初學者或專家同樣方便。UCINET如其他的網絡分析軟體,它處理的原始Data Set必須是由研究者所coding的actor-actor或actor-issue 矩陣資料,透過個人與個人或個人與事件間的"關係",電腦乃能辨識其處理的分析單位,並且透過不同的指令來作不同的分析,當然,如SPSS和SAS一般,UCINET原始資料的基本性質也決定了分析的層次,不過UCINET也有可能對資料作某種程度的轉型 (Transformation)。
Version 6.773-6.772
Changes
» Added Properties|Nodes|Symbols|Shade option to NetDraw 1.83. This allows you to represent an ordinal attribute as shades of grey
» Fixed bug in Properties|Lines|Size|Tie Strength which could sometimes yield incorrect results when the number of edges exceeded the number of nodes
» Added classic multidimensional scaling routine to the menu. See Tools|Scaling/Decomposition|Classic MDS.
» Added additional option to Tools|Scaling/Decomposition|Metric MDS. Now, you can choose a "classic MDS" solution (sometimes known as Torgerson-Gower scaling), as well as minimizing stress.
» Added ClassicMDS command to the CLI to provide 2-dimensional classic scaling.
Description. Performs classic (Torgerson-Gower) multidimensional scaling. The input is a valued dissimilarity matrix. The output is a set of coordinates in 2-dimensional space. The ADD option adjusts the diagonal of the matrix so that it conforms to Euclidean distance. The METRIC option causes the program to iterate the classic solution to minimize stress in two dimensions.
Syntax: classicmds(
Usage
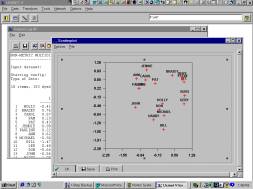
->coord = classic(cities) //coord can then be viewed in tools|scatterplot
Requirements and Specifications
- Windows operating system Vista or later. If you have a Mac or Linux, you can run UCINET via a Windows emulator, such as Parallels or Oracle VM VirtualBox.
- 100mb of disk space for the program itself (not including your data)
- The installation program installs both a 32-bit version and a 64-bit version. The 32-bit version can't take advantage of more than 3GB of memory. If you have large data and a 64-bit version of Windows, you can use the 64-bit version, in which case 8GB of RAM or more would be useful. Remember, however, that even if a really large dataset fits in memory, it may take too long to analyze.
- While the absolute maximum network size is 32767 nodes, in practice most UCINET procedures are too slow to run networks larger than about 5000 nodes. However, this varies depending on the specific analysis and the sparseness of the network. For example, UCINET can calculate the geodesic distance between all pairs of points in a network of 5000 nodes and 1.25 million edges in 14 seconds. But beta centrality on the same network would take too long to be practical.
It assumes that the software has been installed with the data in the folder C:\Program Files\Analytic Technologies\Ucinet 6\DataFiles and this has been left as the default directory.
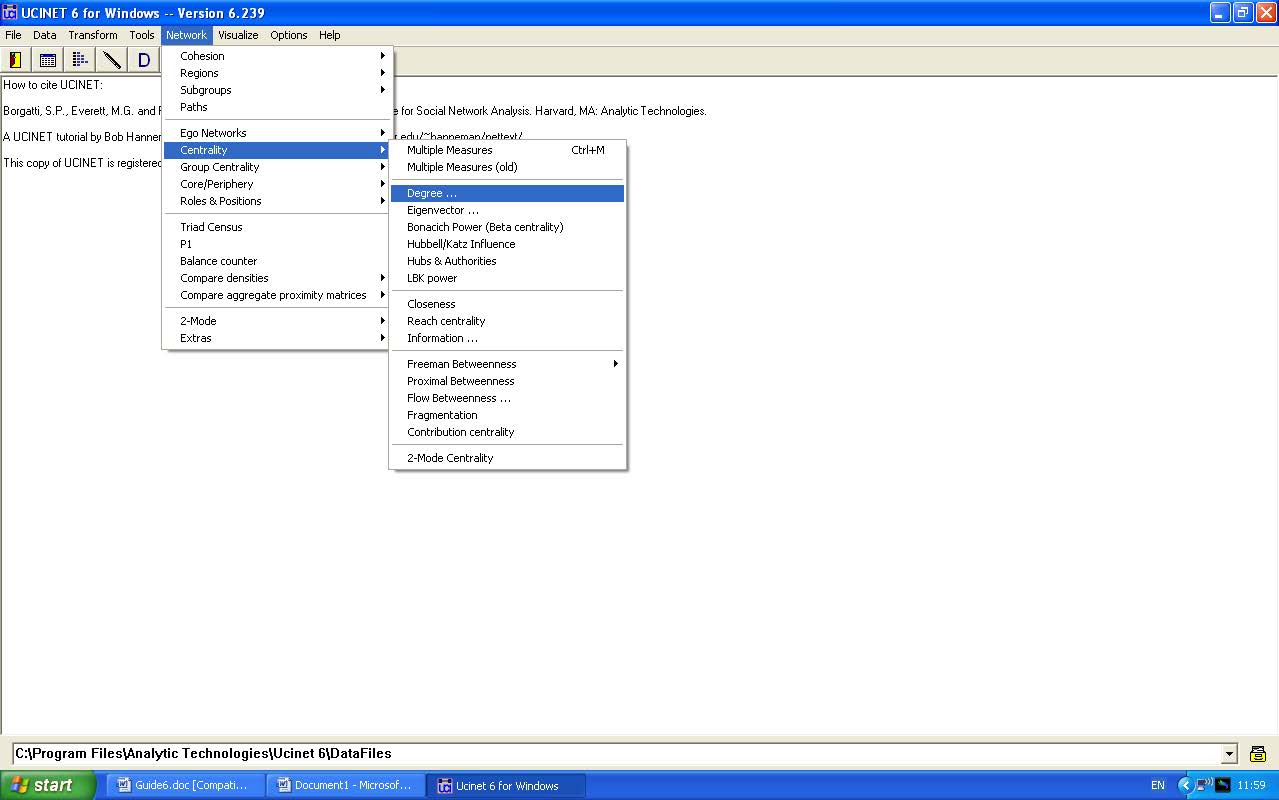
When UCINET is started the following window appears.
.jpg)
The submenu buttons give access to all of the routines in UCINET and these are grouped into File, Data, Transform, Tools, Network, Visualize, Options and Help. Note that the buttons located below these are simply fast ways of calling routines in the submenus. The default directory given at the bottom is where UCINET picks up any data and stores any files (unless otherwise specified) this directory can be changed by clicking on the button to the right.
Running a routine
To run a UCINET routine we usually need to specify a UCINET dataset and give some parameters. Where possible UCINET selects some default parameters which the user can change if required. Note that UCINET comes with a number of standard datasets and these will be located in the default directory. When a routine has been run there is some textual output which appears on the screen and usually a UCINET datafile contain the results that again will be stored in the default directory.
We shall run the degree centrality routine to calculate the centralities of all the actors in a standard UCINET dataset called TARO. First we highlight Network>Centrality>Degree and then click
This will bring up a box as follows
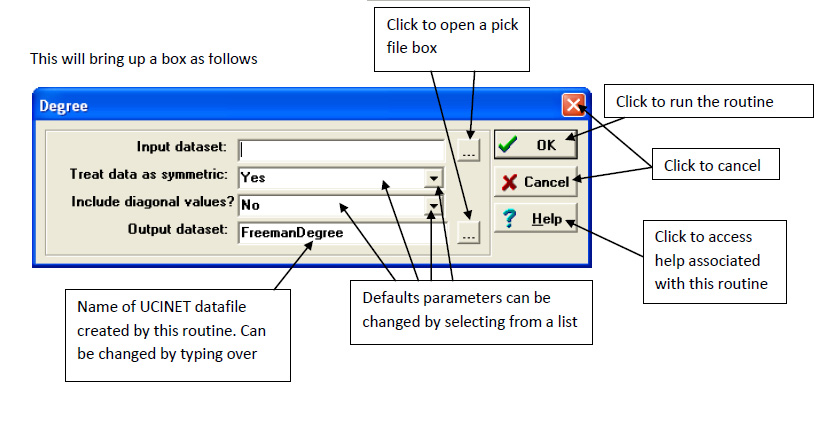
If you click on the help button then a help screen will open which looks like this. The help file gives a detailed description of the routine, explains the parameters and describes the output that will appear in the log file and on the screen.
.bmp)