
ntopng 網路流量分析工具
High-Speed Web-based Traffic Analysis and Flow Collection.
高速 Web 網站流量分析和採集
支持跨平台,包括所有 Unix 平台、MacOS X 和 Windows。
ntopng 是原始 ntop 的新一代版本,一個顯示網絡使用情況的網絡流量探測器,與受歡迎的 Unix command 命令類似。 ntopng 基於 libpcap,以可攜式的方式編寫,以便在每個 Unix 平台,MacOSX 和 Windows 上虛擬運行。
ntopng 使用者可以用 Web 瀏覽器瀏覽 ntop(作為 Web 伺服器)掌握網站流量信息並創建網絡狀態的轉儲通信數據。在後一種情況下,ntopng 可以看作是具有嵌入式 Web 介面的類似 RMON 的 agent。 使用在:
- 一個網頁介面 web interface
- 藉由 Web 介面進行有限的configuration和管理
- 減少 CPU 和內建記憶體使用(根據網絡規模和流量而有所不同)
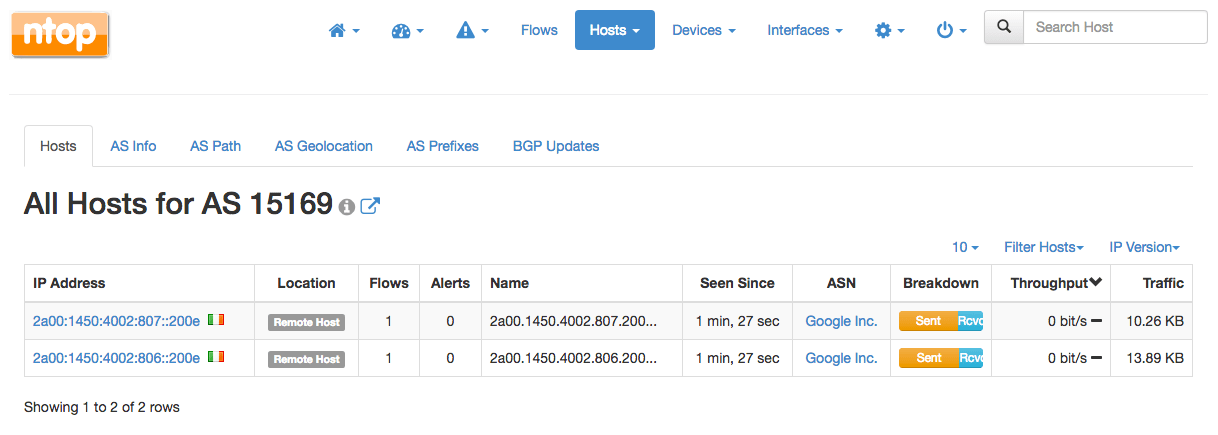
- Sort network traffic according to many criteria including IP address, port, Layer-7 (L7) application protocols, throughput, Autonomous Systems (ASs)
- Show realtime network traffic and active hosts
- Produce long-term reports for several network metrics including throughput and L7 application protocols
- Top talkers (senders/receivers), top ASs, top L7 application protocols
- Monitor and report live throughput, network and application latencies, Round Trip Time (RTT), TCP statistics (retransmissions, out of order packets, packet lost), and bytes and packets transmitted
- Store on disk persistent traffic statistics to allow future explorations and post-mortem analyses
- Geolocate and overlay hosts in a geographical map
- Discover Layer-7 application protocols (Facebook, YouTube, BitTorrent, etc) by leveraging on nDPI, ntop Deep Packet Inspection (DPI) technology
- Analyze IP traffic and sort it according to the source/destination
- Report IP protocol usage sorted by protocol type
- Produce HTML5/AJAX network traffic statistics
- Full support for IPv4 and IPv6
- Full Layer-2 support (including ARP statistics)
- GTP/GRE detunnelling
- Support for nIndex, MySQL, ElasticSearch and LogStash export of monitored data
- Interactive historical exploration of monitored data exported to nIndex and MySQL
- Flexible alerts handling
- SNMP v1/v2c/v3 support and continuous monitoring of SNMP devices
- Identity Management, including correlation of VPN users to traffic
- Focused on cybersecurity
- Behavioral traffic analyses such as lateral movements and periodic traffic detection
- REST API to ease integrations with third-parties
| Platforms |
|
| Web GUI |
|
| Requirements |
|
| Protocols |
|
| Extensibility |
|
| Additional Features |
|
| Feature | Pro | Enterprise | ||
| M | L | XL | ||
| Monitor the active flows and hosts of your network (number of interfaces) † | 8 | 16 | 32 | 64 |
| Monitor Remote Hosts using active monitoring (ICMP, Continuous ICMP, HTTP/S, Throughput, SpeedTest) | ✓ | ✓ | ✓ | ✓ |
| Monitor the system, machine on which ntopng is running, Health (CPU usage, RAM usage, Disk Space used, …) | ✓ | ✓ | ✓ | ✓ |
| Identify application protocols (Facebook, Youtube, BitTorrent, etc) in the network | ✓ | ✓ | ✓ | ✓ |
| Record and Visualize hosts’ historical application protocols usage (timeseries) | ✓ | ✓ | ✓ | ✓ |
| Group hosts by VLAN, Operating System, Country, and Autonomous Systems | ✓ | ✓ | ✓ | ✓ |
| Get a geographic map of your network communications with the rest of the world | ✓ | ✓ | ✓ | ✓ |
| Discover the devices connected to your Local Network (Network Discovery) | ✓ | ✓ | ✓ | ✓ |
| Identify top talkers (senders and receivers) hosts with minute resolution | ✓ | ✓ | ✓ | ✓ |
| Visualise the top HTTP sites contacted by an host | ✓ | ✓ | ✓ | ✓ |
| Export expired flows information to database, possibly augmented with nProbe data ** | ✓ | ✓ | ✓ | ✓ |
| Generate alerts (for Flows, Hosts, Interfaces, …) when certain conditions are detected (Threshold Crossed, Suspicious Behaviour, …) | ✓ | ✓ | ✓ | ✓ |
| Navigate through the alerts, from the GUI, generated by ntopng to find the problem | ✓ | ✓ | ✓ | ✓ |
| Get alerts notifications as Email, Discord, Telegram, WebHook, Slack, Syslog messages or execute Shell Scripts | ✓ | ✓ | ✓ | ✓ |
| Split, merge, and visualize VLAN based traffic | ✓ | ✓ | ✓ | ✓ |
| Collect data from nProbe to treat remote nProbe-monitored interfaces and flow exporter devices (for example routers and switches) as if they were local | ✓ | ✓ | ✓ | ✓ |
| Split, merge, and visualize data collected from nProbe | ✓ | ✓ | ✓ | ✓ |
| Group local hosts into logical sets of IP and MAC addresses known as host pools †† | ✓ | ✓ | ✓ | ✓ |
| Add/edit application protocols to ntopng (if a protocol file is configured) and edit protocol categories | ✓ | ✓ | ✓ | ✓ |
| Mark and historicize traffic with user-defined traffic profiles to match hosts, ports and applications using the BPF syntax (number of profiles) | 16 | 128 | 128 | 128 |
| Limit or block hosts’ traffic with customized per-application policies * | ✓ | ✓ | ✓ | ✓ |
| Integrate ntopng login with LDAP authentication servers * ** | ✓ | ✓ | ✓ | ✓ |
| Send alerts to Elasticsearch, to MS Teams or to Fail2Ban | ✓ | ✓ | ✓ | ✓ |
| Have access to other ntopng Checks (Alerts) | ✓ | ✓ | ✓ | ✓ |
| Add the possibility to create the Network Matrix timeseries (gives the possibility to check traffic between Local Networks) | ✓ | ✓ | ✓ | ✓ |
| Visualize and historicise other ntopng data (Interface Score Anomalies, Top Talkers, …) | ✗ | ✓ | ✓ | ✓ |
| Generate graphical reports with top hosts, application protocols, countries, networks, and autonomous systems within any configurable time frame | ✗ | ✓ | ✓ | ✓ |
| Query SNMP devices data, such as port status, traffic and and MAC address information | ✗ | ✓ | ✓ | ✓ |
| Get total traffic and activity reports for any given host, network, or interface | ✗ | ✓ | ✓ | ✓ |
| Identify attackers and victims through an alerts dashboard in realtime and in the past | ✗ | ✓ | ✓ | ✓ |
| Visualize host pools’ historical applications protocols usage | ✗ | ✓ | ✓ | ✓ |
| Explore and filter flow alerts in the past | ✗ | ✓ | ✓ | ✓ |
| Trigger alerts when SNMP unexpected behavior shows up | ✗ | ✓ | ✓ | ✓ |
| Have access to other ntopng Checks (Alerts, such as SNMP Alerts) | ✗ | ✓ | ✓ | ✓ |
| Visualize and historicise SNMP per-device-port traffic | ✗ | ✓ | ✓ | ✓ |
| Visualize and historicise NetFlow/sFlow devices data | ✗ | ✓ | ✓ | ✓ |
| Aggregate and Analyze Long-term flow data | ✗ | ✓ | ✓ | ✓ |
| Apply per-protocol daily traffic and time quotas to your clients * | ✗ | ✓ | ✓ | ✓ |
| High performance flow export to ClickHouse and explorer (both aggregated data explorer and historical flow explorer) * | ✗ | ✓ | ✓ | ✓ |
| Custom Interface Disaggregation † | ✗ | ✓ | ✓ | ✓ |
| Monitor other ntopng instances (Infrastructure Monitoring) | ✗ | ✗ | ✓ | ✓ |
| Hosts Map (find the hosts outliers) | ✗ | ✓ | ✓ | ✓ |
| Netflow exporters and ports monitoring (number of exporters) | ✗ | 256 | 256 | 1024 |
| Service / Periodicity Maps | ✗ | ✗ | ✓ | ✓ |
| Identity Management with Firewalls and Active Directory | ✗ | ✗ | ✓ | ✓ |
| Have access to all Behavioural Checks | ✗ | ✗ | ✓ | ✓ |
| Native nTap Support | ✗ | ✗ | ✓ | ✓ |
| Kafka Support | ✗ | ✗ | ✓ | ✓ |
| OT/SCADA: IEC 60870-5-104 Traffic Analysis | ✗ | ✗ | ✗ | ✓ |
| OT/SCADA: ModbusTCP Traffic Analysis | ✗ | ✗ | ✗ | ✓ |
| Continuous Recording license Included (n2disk 1Gbit)†††† ** | ✗ | ✗ | Bundle L | Bundle L |
| Smart Recording license Included (n2disk 1Gbit)†††† ** | ✗ | ✗ | ✗ | Bundle XL |
| Flow Collection license Included (nProbe Pro)†††† | ✗ | ✗ | Bundle L | ✗ |
| Flow Collection license Included (nProbe Enterprise S)†††† | ✗ | ✗ | ✗ | Bundle XL |
* Feature not available on Windows
** Feature not available on FreeBSD / OPNsense / pfsense
† On adequate hardware (the actual limit may be lower according to system resources).
†† The Enterprise version allows the creation of up to 128 different host pools with an unlimited number of pool members. Professional and Community versions allow the creation of up to 3 different host pools with a maximum of 8 members per pool.
†††† Here you can read more about the software bundled with the Bundle edition
All versions are meant to be used on a “full-fledged PC” such as an x86 machine. Users who plan to install ntopng on Raspberry devices, should consider using the RaspberryOS packages available for ARM.
PF_RING
High-speed packet capture, filtering and analysis.
PF_RING™ is a new type of network socket that dramatically improves the packet capture speed, and that’s characterized by the following properties:
- Available for Linux kernels 2.6.32 and newer.
- No need to patch the kernel: just load the kernel module.
- 100 Gbit Hardware-based Packet Filtering using commodity network adapters on Intel and NVIDIA/Mellanox.
- User-space ZC drivers for extreme packet capture/transmission speed as the NIC NPU (Network Process Unit) is pushing/getting packets to/from userland without any kernel intervention. Using ZC drivers you can send/received up to 100 Gbit wire-speed any packet size.
- PF_RING ZC library for distributing packets in zero-copy across threads, applications, Virtual Machines.
- Agnostic API for device driver independent application code.
- Zero-copy support for Intel, NVIDIA (Mellanox), Napatech, Silicom FPGA (Fiberblaze), and other network adapters.
- Kernel-based packet capture for all adapters, when not supported by ZC.
- Libpcap support for seamless integration with existing pcap-based applications.
- Optimized nBPF filters in addition to the legacy BPF.
- DPI content inspection with nDPI, so that only packets matching the desired L7 protocols are passed.
n2disk
n2disk™ is a network traffic recorder application. With n2disk™ you can capture full-sized network packets at multi-Gigabit rate (above 10 Gigabit/s on adequate hardware) from a live network interface, and write them into files without any packet loss. n2disk™ has been designed to write files into disks for very long periods, you have to specify a maximum number of distinct file that may be written during the execution, and if n2disk™ reaches the maximum number of files, it will start recycling the files from the oldest one. This way you can have a complete view of the traffic for a fixed temporal window, knowing in advance the amount of disk space needed.
n2disk™ uses the industry standard PCAP file format to dump packets into files so the resulting output can be easily integrated with existing third party or even open/source analysis tools (e.g. Wireshark).
n2disk™ has been designed and developed mainly because most network security systems rely on capturing full-size packets, since any packets may have been responsible for the attack or could contain the problems that we are trying to find. Netflow information is more manageable and requires less disk space to be stored, but in some cases, like deep-packet-inspection analysis or controlled traffic regeneration, it is not useful.
n2disk™ can be effectively used to perform numerous activities, among these:
- Off-line network packets analysis by feeding a specialized tools like Snort.
- Reconstruct particular communication flows or network activities.
- Reproduce the previous captured traffic to a different network interface.
nTap
Virtual Network Tap for Hosts/Cloud/Containers/VMs
nTap is a virtual software tap that can be used in physical/virtual/cloud environments to remotely capture traffic (with respect to the monitoring location) and delivering packets to the observation point in a secure way. Packet capture is required whenever flow-based analysis tools such as nProbe/nProbe Cento are not suitable as packet-level analysis is required. The main differences between a physical tap and nTap include:
- nTap is able to deliver monitored traffic remotely (a physical tap requires a direct cable connection forcing to monitor traffic where it is generated).
- nTap delivers packets with end-to-end encryption preventing intruders from watching monitored traffic.
- nTap can apply packet filtering on monitored traffic (physical taps are unable to do this: more expensive packet brokers provide this feature).
- nTap can be used in containers and virtual machines as well highly dynamic environments such as Kubernetes (a physical tap can be used only on a physical network).
nTap is based on two components:
- nTap remote it is installed on the remote device for which need to monitor traffic.
- nTap collector receives encrypted packets sent by nTap remote, decrypts them, and push them on a virtual ethernet interface where you can attach applications such as Wireshark, tcpdump, Suricata or Snort.
disk2n
disk2n is able to replay network traffic previously captured with n2disk on live networks observing the original inter-packet time. disk2n supports the industry standard PCAP file format (with both regular and nanosecond timestamps).
disk2n has been designed to replay multiple pcap files of any size (even terabytes of traffic) with limited memory usage. You can specify a playlist of pcap files or a timeline produced by n2disk with a time interval, and instruct disk2n to continue from the first packet when the last one is reached. It is possible to determine in advance the amount of memory used by disk2n: it uses a memory buffer of arbitrary size to cache the next packets to replay, achieving great transmit performances with limited memory usage.
disk2n can be effectively used to perform numerous activities, among these:
- Reproduce selected long-term network activities.
- Replay previously captured traffic to a different network interface.
- Generate traffic to test network equipments that no traffic generator can do being them usually limited in replay duration.
nProbe
An Extensible NetFlow v5/v9/IPFIX Probe for IPv4/v6
In commercial environments, NetFlow is probably the de-facto standard for network traffic accounting. nProbe includes both a NetFlow v5/v9/IPFIX probe and collector that can be used to play with NetFlow flows. This means nProbe™ can be used:
- To collect and export NetFlow flows generated by border gateways/switches/routers or any other device that can export in NetFlow v5/v9
- As a drop-in replacement of embedded, low-speed, NetFlow probes that may already been deployed
- To analyze multi-Gbit networks at full speed with no (or very moderate) packet loss
- To send monitored flows towards a collector such as the open-source ntopng or a commercial one (e.g. Cisco NetFlow Collector or Plixer)
nScrub
nScrub is a DDoS mitigation system based on PF_RING ZC, able to operate at 10 Gigabit/s line-rate using a low-end system, and scale to Terabit/s building a modular architecture.
nScrub can be implemented as bump in the wire (transparent bridge) or as router (to be used with BGP diversion techniques), both in asymmetric mode (i.e. mitigate only one traffic direction, from Internet to the protected network) or symmetric mode (i.e. mitigate from Internet to the protected network, but also forward the outbound traffic).
nScrub has been designed as an extensible platform, meaning that it can be extended for the definition of new additional algorithms for traffic mitigation, to be used in addition to those part of nScrub.
nScrub provides a REST API for configuring the engine, combined with a shell-like CLI tool with auto-completion.